
The Russell 2000 Index is a collection of 2000 small and medium cap stocks. It is thought to be a barometer for the health of the US economy as the Russell 2000 Index value is not based on a small concentration of stocks. As a result, a rising index would suggest many of the companies are enjoying gains while a falling index implies struggles for main street USA.
Russell 2000 Index value and news that affects it
One of the first thoughts that newer investors seek to answer is “what news affects the index?”
There are a lot of ways to answer this. The Russell 2000 Index was designed to reflect a wide range of businesses to gauge the health of the economy. Rather than having to individually pick a winning stock in a winning industry, the Russell 2000 is a way to trade the whole economy. Therefore, one might answer, follow the news that affects small and medium-sized businesses.
However, I would argue that news is backward-looking and does not forecast what is to come.
For example, look at the recent Russian invasion of Ukraine. A political disruption such as that conflict surely would send the markets into a tailspin. However, the day after the invasion Russell 2000 began a 12% rally.
Studying the price action on the charts via Elliott wave provides better analysis.
Can Elliott wave apply to the stock market?
In short yes. Elliott Wave Theory can apply to any market with an abundance of buyers AND sellers. The Russell 2000 Index is such a tool that it is widely followed. This push and pull between buyers and sellers allow an Elliott wave analyst to review the trends.
Elliott wave is an analytical method that studies the shape and structure of the rallies and corrections. Elliott wave has five basic patterns that create even larger patterns. An Elliott wave analyst will review the rallies and corrections to determine what pattern is currently in development.
What is the current Elliot wave for Russell 2000 Index?
It appears Russell 2000 Index is in the first half of a third wave decline. We are expecting a total of five waves in place before a really large rally will develop. Right now, we are within the first half of wave 3.
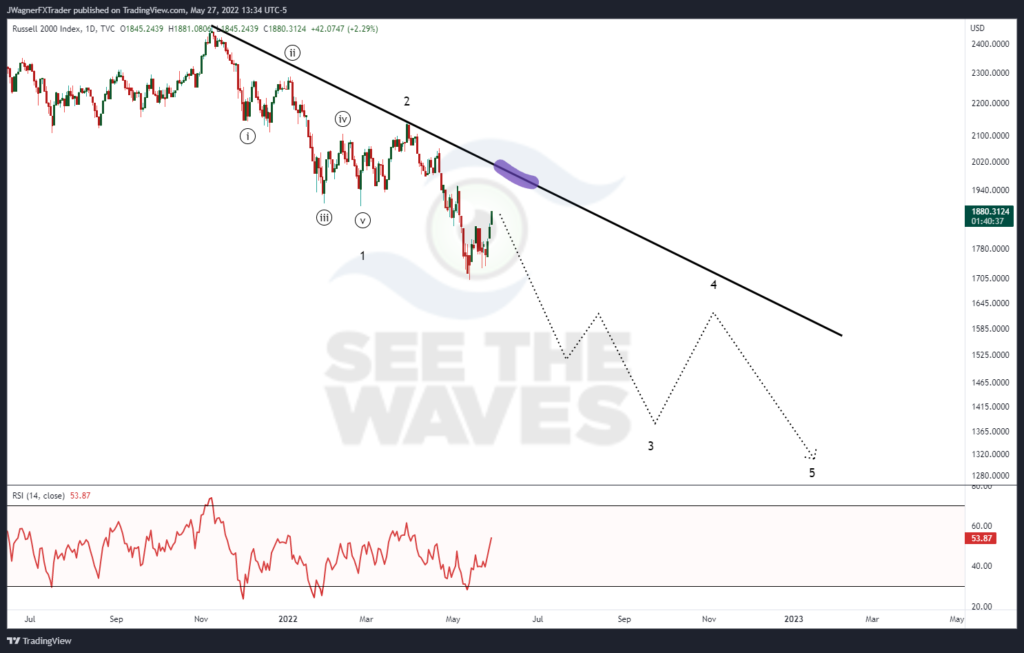
This suggests we still have the second half of wave 3, a brief rally in wave 4, then another correction lower in wave 5 before any significant rally develops.
Even though the price has rallied this week, this rally will likely prove temporary. The rally could grind a little higher but we are getting close to a turning point and another round of HEAVY selling.
A continued rally does not have to develop, but higher price levels will afford long traders a chance to exit and short traders a chance to enter. $1920-$1975 becomes a stretch zone where the Russell 2000 Index is walking on thin ice. Again, Russell does not have to rally up to those levels. Russell could rally even higher. The key point is that intense selling appears just around the corner.
What’s next for Russell 2000?
The next round of intense selling will likely carry the index down near $1400. This is still on target from what we forecasted on April 1, 2022 “US Stocks at Risk of Bearish Collapse”. Back on April 1, we spotted $1643 and possibly $1400 as targets.
Once the next round of intense selling ends (possibly near $1400), a rally may develop in wave 4, then another round of selling in wave 5 that carries lower to near $1300.
Near the current price of $1878, these levels represent another 25-30% peeling back from prices. This would place the overall decline near 50% from the all-time highs.
Learn to read the waves with Elliott wave
In our Spotting Trends and Surfing Waves with Elliott wave course, we teach you how to stop reading the news to learn how to read the market and its wave correctly. This will help you find the right side of the trends.
You might also be interested in…
Has the FX market made you loonie? (A USD/CAD case example)
How Elliott wave and Relative Strength Index (RSI) work together