
Elliott Wave Theory is one of the most misunderstood methods of chart reading. Though Elliott Wave Theory has been around for 90 years and the rules are clear, human error in interpreting the charts causes many traders to suggest Elliott wave doesn’t work. In reality, many traders simply have not taken the time to learn Elliot wave, its rules and guidelines.
One way to learn a new skill is to compare it to a previously mastered skill. Today, we will cover how a popular technical indicator called the Relative Strength Index (RSI) can be used to help you identify Elliot wave.
You’ll notice there is an RSI located at the bottom of each Elliott wave chart I produce. The RSI is a tool in my Elliott Wave toolbox, though versatile, serves only one specific purpose for me and it can help you spot the current Elliot wave.
What is the Relative Strength Index (RSI)?
The Relative Strength Index (RSI) is a common tool used by traders to determine the strength of trends and market signals. When added to the charts, this tool appears at the bottom (or top) of the chart as a separate pane.
The RSI is a bounded oscillator which means its readings will be between 0 to 100. The output of the RSI is a number that suggests what the strength of the trend is over the past few bars on a chart.
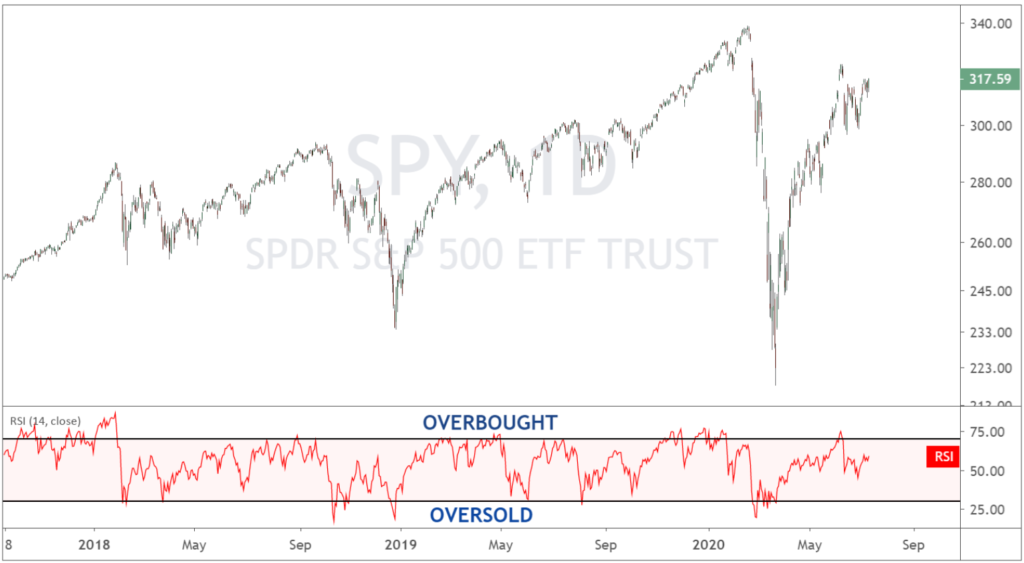
When the RSI is above 70, that is seen to be a strong and overbought market, and if below 30 a weak and oversold market. A reading above 70 does not mean the market HAS TO and WILL reverse as markets can remain overbought or oversold for extended periods of time.
If only there was a way to determine how mature a particular trend is…wait, Elliot Wave Theory can do that for us!
Within Elliot wave, we can assess the market’s patterns to determine which Elliott wave pattern is carving. Once we know the current Elliott wave, we can then forecast how mature the current trend is based on Elliott’s rules and guidelines.
As a result, whether a market is overbought or oversold has limited use to us as Elliott wave traders. Rather, we can use the RSI combined with Elliott wave to determine divergence between the oscillator and price.
What is RSI Divergence?
RSI divergence occurs when the market makes a new price high, but the RSI oscillator creates a lower high. This behavior on a price chart is a symptom of a tired trend.
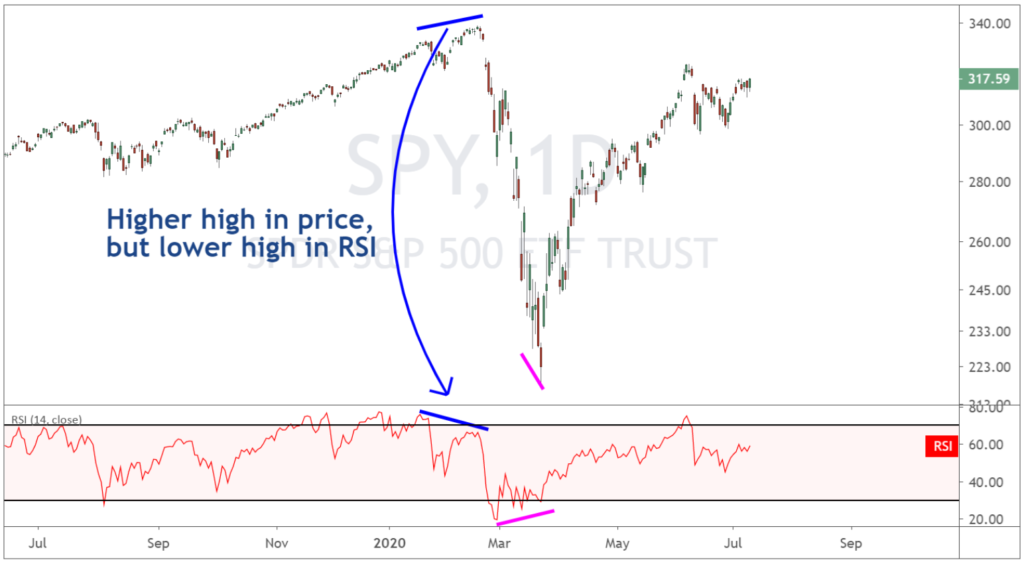
On the chart above, notice how price made a new high, yet RSI was creating a lower high that could not even reach overbought levels. This suggests that the trend is mature and a reversal may be approaching.
Then, after the sell-off, RSI divergence appeared again. This time price was making a lower low, but RSI was making a higher low. Again, this is symptomatic of a tired trend and potential for a trend reversal higher.
Combining Elliott Wave with RSI Divergence
Tired trends occur within certain places within an Elliott wave structure. The 5th wave of a motive wave oftentimes will occur on diverging momentum within RSI. Additionally the ‘B’ wave of a running triangle or expanded flat can occur with divergence on RSI.
When this RSI divergence behavior is witnessed AND if your Elliott wave count suggests we are in the 5th wave, then that provides confidence that the analysis of the market is on track.
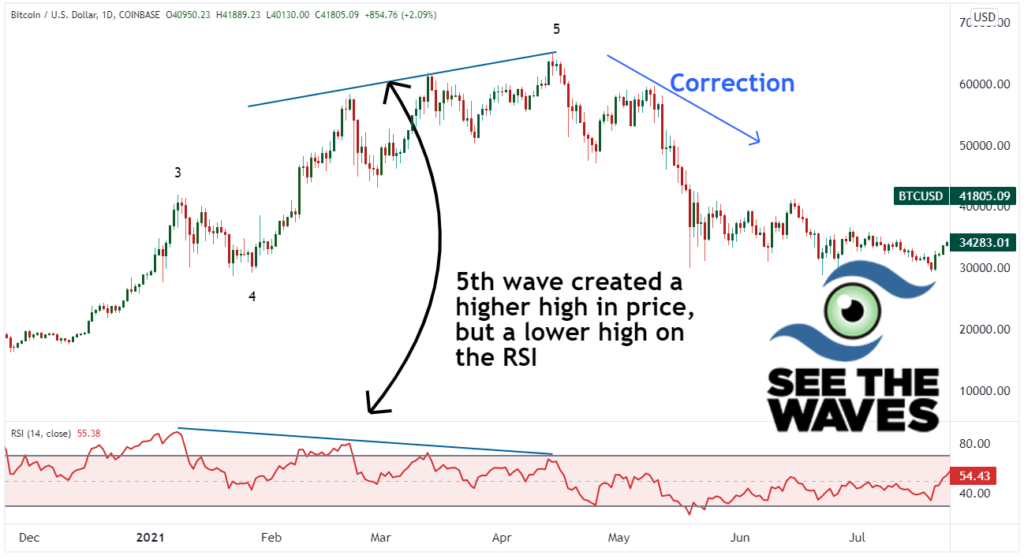
When looking at the bitcoin chart above, we can see a completed bullish impulse wave. Take a look at the wave 5 high and notice how wave 5 was a higher price, but RSI at those same dates created a lower high. This chart pattern helps build confidence that the last high is likely a fifth wave high.
Does RSI Divergence Appear at Each 5th Wave?
Even though we are expecting a 5th wave does not mean that RSI divergence HAS to appear. RSI divergence is simply one of those tools in the toolbox of Elliott wave that guides us to the right path if the other patterns are not real clear.
With that said, on many occasions, RSI divergence appears between the 3rd and 5th waves of Elliott Wave Theory. If you have spotted RSI divergence on your chart, then count the waves to see if it could be a 5th wave. If so, then you can apply the fifth wave measurements to determine how far this fifth wave might travel. If the market is approaching those fifth wave measurements, then you’ll know a large retracement is coming up next.
What if the RSI Divergence Does Not Appear to be a 5th Wave?
There are some situations where you’ll see price poke to a new high, but the RSI oscillator is not following and is resting at a lower high. When you count out the waves and it is clear the new high is not the fifth wave, then it is possible this new high is the ‘B’ wave of an expanded flat or running triangle.
In these scenarios, we can use our ‘B’ wave measurements to determine how far the wave may travel, then anticipate a reversal and deep retracement.
How to Determine 5th Wave and B-Wave Measurements in Elliott Wave
One thing that Elliot Wave Theory does a fantastic job of is describing the harmony of the waves within the market. It takes knowledge, practice, and skill to correctly piece everything together to formulate a solid forecast.
At See The Waves, we have an extensive Elliot wave course to teach students the measurements and how to spot the harmony within the waves. There are several different measurements we can make to estimate the distance of the 5th wave. When the price is approaching these measurements, the risk of a reversal is high and we further explain how deep that reversal may go.
Learn more about our Spotting Trends and Surfing Waves Course.