Some strong trends have developed in FX recently. With these strong trends, every trader has to decide if they are going to continue or reverse. For many traders, this is a difficult decision for a variety of reasons.
First, they may be relatively new to trading and chart analysis. Therefore, they pick the wrong side because of inexperience.
Or, other traders have traded for a year and simply believe the market movements are random and therefore you just need to randomly pick a side and hope for the best.
Other traders have picked the wrong side for many years and decided to play reverse psychology. If they thought it was an uptrend, they’ve been wrong in the past, so let’s do the opposite and trade it as a downtrend.
Yikes!
Well, the market is not random. There are structures, patterns, and harmony within the various trends. If we can figure out the market’s geometry, then we can make reasonable forecasts about what to expect moving forward.
USD/CAD Elliott Wave Case Study
Let’s take a look at some recent forecasts made by See The Waves on USD/CAD.
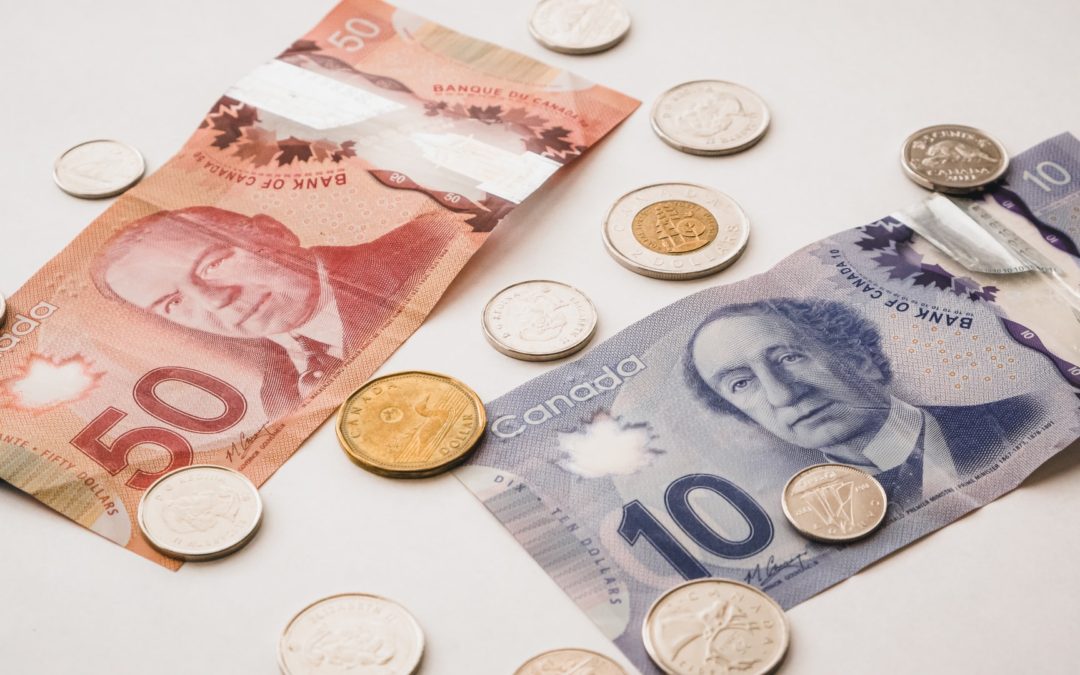
On March 31, we made the note above anticipating one last wave lower. The wave lower did not quite reach the cited target. However, the direction of the market was anticipated.
The next week, we made this note.
“On April 5, we did get a ‘fling’ to 1.2402…not quite as deep as we’d thought.
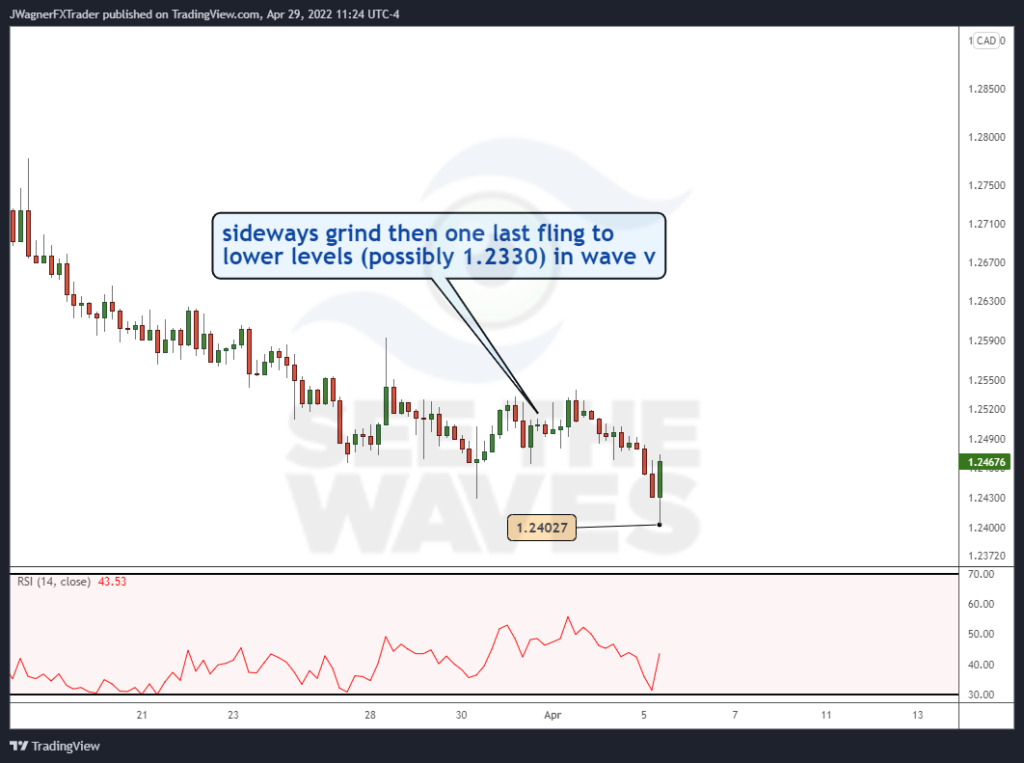
This means the April 5 low is wave ‘v’ or a variation suggests it was wave ((b)) of ‘iv’ (red labels).
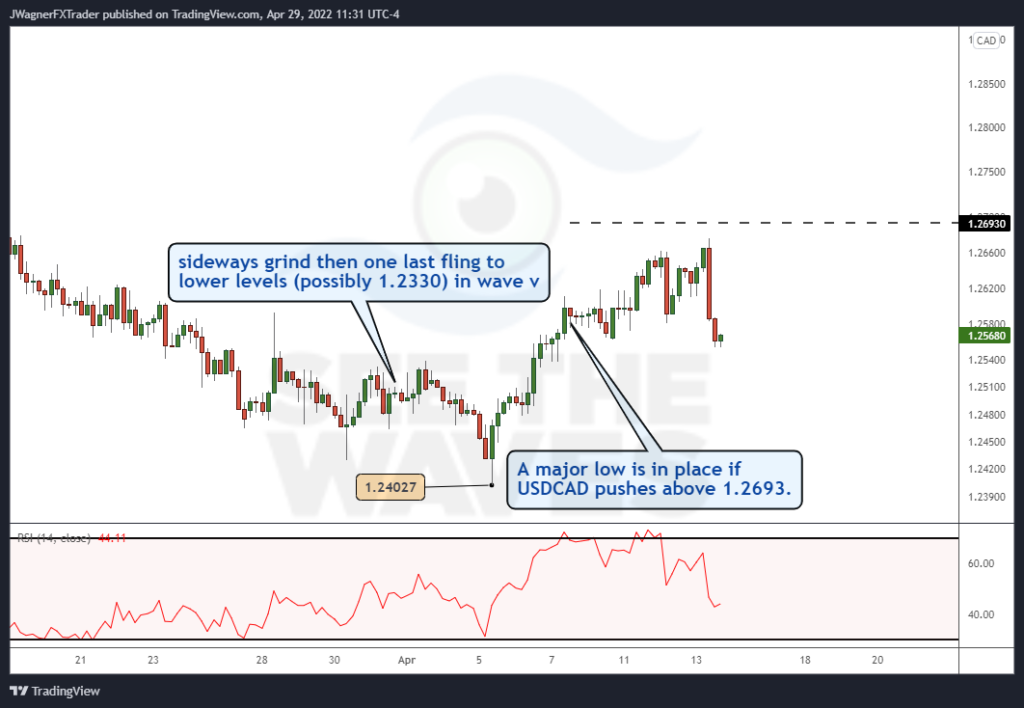
If the black is underway, then a major low is in place if USDCAD pushes above 1.2693.”
You see, oftentimes I share with subscribers an alternate variation (red labels). We never know for sure until the waves are over, so identifying key levels and alternates are like signposts that tell you if you’re on the right pattern.
Price was still below 1.2693 at the time of the forecast, but the evidence was continuing to mount for a bottom at 1.2402. In this case, the sentiment was screaming for more gains in USD/CAD.
With 1.2693 eventually breaking, USDCAD continued its ascent towards 1.29 creating a mid-term top at 1.2880.
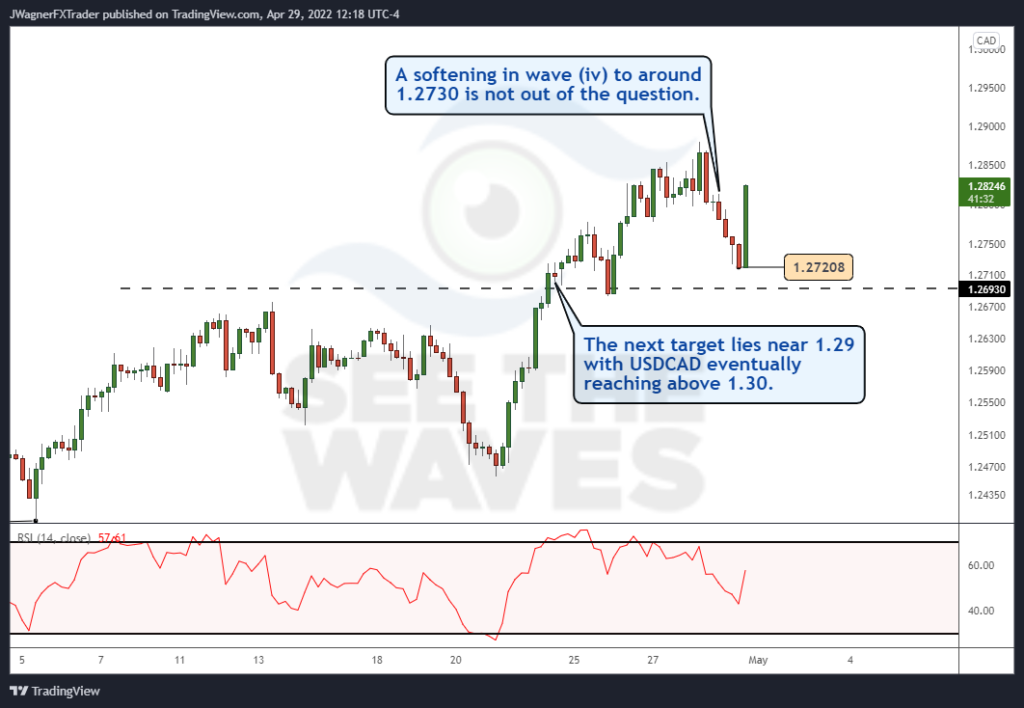
On Thursday, April 28, we forecasted a correction in prices to around 1.2730 and that would be wave (iv). Wave (v) would then rally to above 1.29. Earlier today, USDCAD did plummet to 1.2720…just below the target.
The sequence of events above should give you an idea of the value in knowing the turns and key levels ahead of time.
Learn to spot the trends
Are the markets random? The forecasts above should be enough evidence for the deepest skeptic to consider the market moves are not random.
A low was anticipated in early April before it arrived. We then targeted 1.29.
Earlier this week we forecasted a correction that eventually played out today. A lucky person wouldn’t be able to make those specific forecasts in a random market.
The good news is that you can also stay ahead of the FX market trends.
Join FX Weekly Analysis to receive a weekly analysis of:
- EURUSD
- DXY
- USDJPY
- AUDUSD
- GBPUSD
- USDCAD
In fact, I just shared with subscribers this week how one of the markets above is getting ready to turn towards a multi-thousand pip trend.
For those who are not sure if FX Weekly Analysis is right for them, when you join today, you won’t have to make your first investment for 7-days. This will give you a chance to try this out risk-free for a week and not have to pay anything.
Frequently Asked Questions
How long do I have access?
Access is based on a month-to-month basis and is good until canceled. Each month is a $49 investment.
Is there a trial period?
Yes, if you enroll today, you’ll receive the first 7-days for no charge. The first investment will be charged in 7-days. You can cancel anytime during the 7-day trial to prevent the first payment.
Do you have examples of other forecasts?
Yes, here are some samples for AUD/USD.
We have a weekly service for these FX markets in our FX Weekly Analysis:
- EUR/USD
- DXY
- GBP/USD
- AUD/USD
- USD/JPY
- USD/CAD
Additionally, for crypto lovers, check out our Crypto Corner where we provide weekly analysis for these markets:
- Bitcoin
- Ethereum
I don’t know much about Elliott wave. How can I learn more?
We have an on-demand Elliott wave course designed with you in mind. We will teach you the Elliott wave patterns and work with you to learn to spot them on the charts. By learning the patterns, you’ll minimally be better equipped to read Elliott wave charts. With enough time spent, you could also correctly label the charts yourself.
How long does it take to learn Elliott wave?
It depends on how much time is spent learning and what your starting point of knowledge is. For the average person, I would budget 12 months to learn Elliot wave. Some traders may be quicker and others might take longer.