Over the past three weeks, we have experienced significant event risk and trend reversals in the FX markets.
It started off with the Fed announcing on January 26 that they will begin raising interest rates in March. The market generally has not believed the Fed will follow through and tighten monetary policy. As a result, US dollar rallied hard on the news for two days.
Then, on January 28, the US dollar found a top, then reversed hard unwinding the gains witnessed since Jan 26.
A week later the figures for the latest US jobs report were released. The figure came back better than expected and the US dollar abruptly reversed and began to strengthen again.
To add to the volatility, on Thursday of this week, the latest US inflation figures were released. The US dollar initially spiked lower on the news, only to reverse hard and retrace the entire move a few hours later.
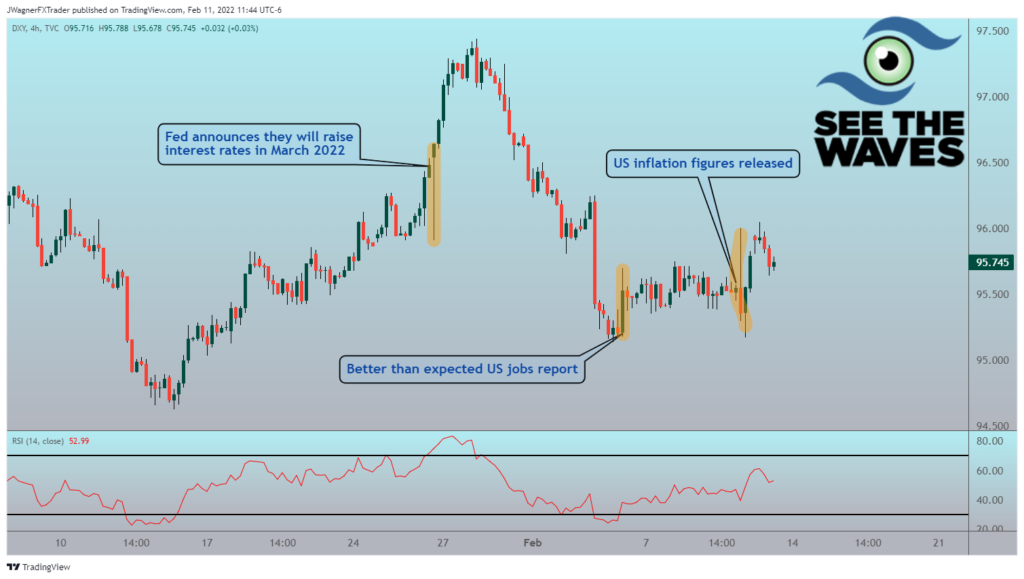
Notice how the news release created large price ranges. Additionally, the trend has changed several times during this three-week period.
How is an FX trader supposed to profitably navigate this volatility?
Here at See The Waves, we teach and use an advanced style of analysis called Elliott Wave. Elliott wave allows us to look at the patterns in the market to determine how mature a trend is and potential reversal points. As a result, traders can plan out trades ahead of time without getting caught in the emotion of the moment, reacting on a whim, and making poor trading decisions.
How do news events factor into Elliot Wave analysis?
We view Elliott wave as a process that describes the market’s sentiment. As a result, the day-to-day news has an insignificant effect on the bigger trends in the market.
Have you ever noticed that there are times when good economic data is released and the market falls. There are other times when bad economic data is released and the market rallies.
It is one thing to predict the economic data. It is entirely a different animal when you are trying to forecast how the market will react to economic data.
Elliott wave provides a framework for how the market is behaving. If we can correctly identify what pattern is carving, we can use that framework to provide determine a trend bias and estimate potential turning points.
Therefore, when economic data is released, regardless of whether it is good or bad, we have a roadmap of what we are anticipating price behavior to look like.
An example of Elliott Wave applied – AUD/USD
Let’s use the recent three weeks of volatility and trend changes as a backdrop for applying Elliott wave. In our FX Weekly Elliott Wave Analysis service, we provide weekly chart analysis to six major FX pairs. Let’s take a close look at the comments we made using Elliott wave applied to AUD/USD.
On February 2, two days BEFORE the US jobs report was released, we forecasted:
AUDUSD Analysis – Feb 2
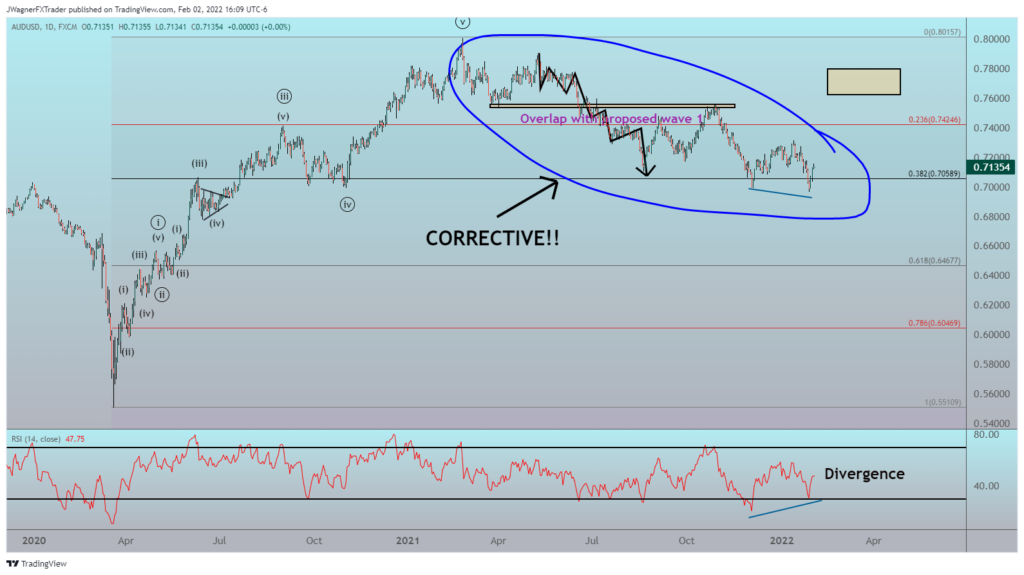
Starting with a daily chart, the rally from March 2020 to February 2021 is an impulse wave advance. For the past year, AUDUSD has been correcting this advance and grinding lower.
The decline in February/March 2021 starts off with 3-waves that tip its hand this is a large corrective dip. Additionally, we have an overlap where an experienced EW’er might suggest a wave 1 and wave 4 might land (see purple writing and small tan box).
On top of this evidence, we have RSI divergence building at last week’s low. This sure looks, smells, and quacks like a corrective decline!
An impulse rally, followed by a choppy decline is a classic 5-3 setup.
The decline from February 2021 has been rather shallow as it has only retraced 38% of the 2020 rally (EUR/USD, on the other hand, retraced 78.6% of its rally).
In light of a USD turn towards weakness, AUDUSD maybe a rocket ready for take-off.
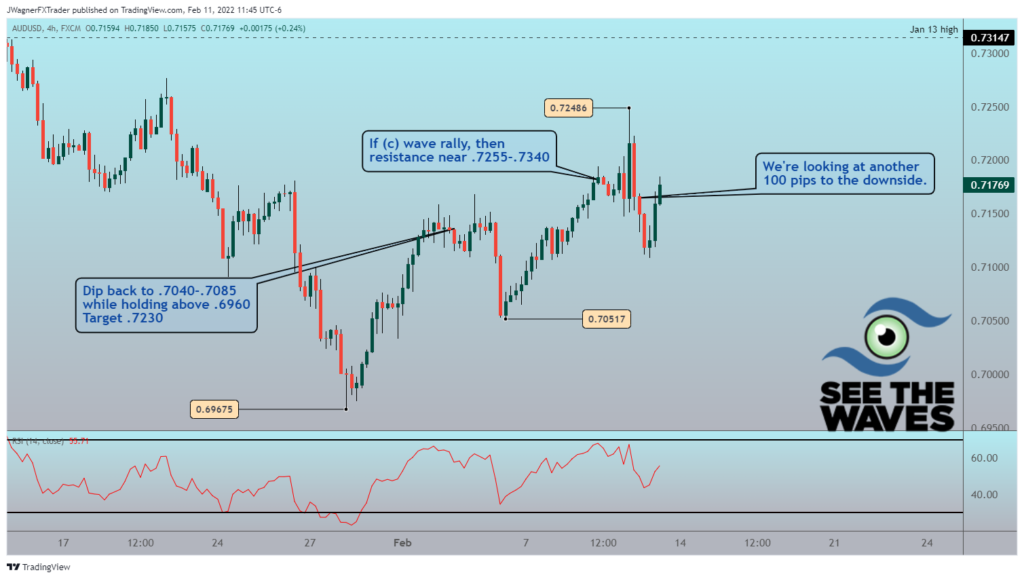
On a 4-hour chart, I can see AUDUSD dipping back from the current .7135 level to a range of support between .7040-.7085. From this range, I would expect to see AUDUSD rally higher to an initial target near .7230, but much higher levels are possible such as 76 cents and 80 cents.
If a trader were going to take a position, use the Jan 28 low as the risk level.
Buy near: .7040-7085
Risk: .6960
Target: .7230; .7800; .8000
Risk to reward ratio: 1.16; 5; 7
Then, in the hours leading up to the US jobs report, AUD/USD began to correct lower to the top of our range near .7085. As the jobs report was released, AUD/USD tanked hard driving down to .7052 which was towards the bottom end of our range forecasted two days prior. Traders were alerted that the potential for a rally was strong.
Shortly thereafter, AUDUSD did begin to take off to the upside.
On February 9, one day BEFORE the US CPI report (inflation report) was released, we forecasted:
AUD/USD Analysis – Feb 9
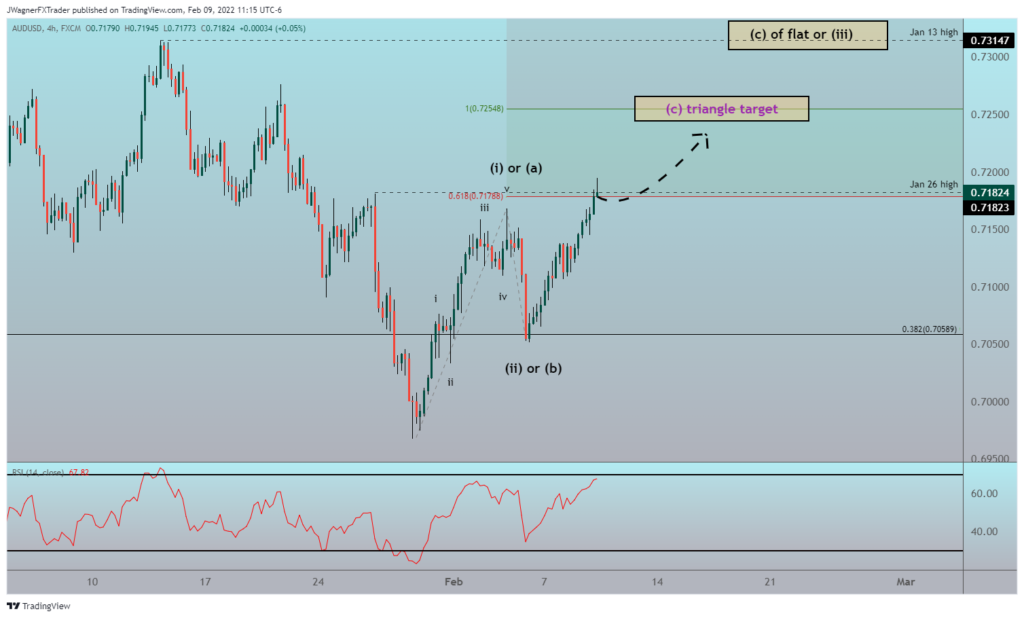
Aussie is progressing as we anticipated last week as it tagged a low of .7051 which was right inside our forecasted range. Aussie is now rallying higher as expected. The first upside target can be adjusted slightly now that we have wave (ii) or (b) low in place.
It is debatable what the wave patterns are to the left of the January 28 low and that debate has an impact on how far AUDUSD rallies.
There is a minor wave relationship near the current .7180 level. I suspect AUDUSD will continue to rally beyond today’s high.
If this is a wave (c) rally, then resistance appears near .7255 – .7340.
If this is a wave (iii) rally, then after a pause near .7315, this will likely carry up to .7378.
We can keep our focus to the upside for now.
AUD/USD was drifting higher leading into the inflation report. As the report was released, AUD/USD tanked hard for a few minutes. Then, it reversed and rallied hard up to our initial target of .7230 set one week earlier and just a few points for our revised target established the day before.
Then, on February 10, an interim report was released because we have seen enough evidence for a larger reversal for AUDUSD.
We’re looking at another 100 pips to the downside.
At the time of this writing, AUDUSD is near .7176 and as the latest Interim report stated, we are looking for another 100 pips lower taking .7060.
Let’s go back to the question posited at the top:
How is an FX trader supposed to profitably navigate this volatility?
FX Weekly Analysis – better analysis, better forecasting
The answer is our FX Weekly Analysis service. Each week, we review AUDUSD (and 5 other FX markets) from an Elliott wave perspective.
FX Weekly Analysis (FXWA) allows experienced Elliott wave traders to use the provided wave counts to quickly identify higher probability trading opportunities.
For newer Elliott wave traders, FXWA will display Elliott wave in action so they can see EW applied to the current market environment. Traders will see trends unfold and see the tools of Elliott wave correctly applied to the real market. As more price data appear, we make adjustments to our wave analysis and newer Elliott wave traders will see those adjustments applied to the current market environment.
Subscribers to the FXWA will receive:
- Weekly Elliott wave analysis by a Certified Elliott Wave Analysis expert on these markets:
- EURUSD
- AUDUSD
- GBPUSD
- USDCAD
- USDJPY
- US Dollar Index (DXY)
- Examples of how to trade the wave count (when the count provides a clear pattern with a good risk to reward ratio opportunity)
- Monthly rate that does not increase
- 7-day free trial
We are currently running a promotion of 30% off $70/month making the monthly investment only $49/month. You will need to act quickly because the discount is available for a limited time only.
Start your free trial now
Getting started is as simple as 1-2-3.
- Set up your See The Waves Account here.
- Enter your card information
- Check the box for “I agree to receive allow instructional emails” (so you are alerted when new analysis is dropped to the portal)
- Access the current report and previous week’s report
- See the waves and ride the trends!
Frequently Asked Questions
Will my rate ever change?
Nope. Your monthly rate will never increase and it is locked in until canceled.
When can I cancel?
We would not expect you to cancel as you are receiving market analysis from a charting expert at an extremely affordable rate.
If it is something we did, please let us know. If there is something we could do to improve the service for you, reach out and make your request known. We want the service to be an excellent value to you.
Let us know by reaching out to us via our “contact us” page.
With that said, sometimes life gets in the way of trading and we understand. The process to cancel is simple:
- Log into your See The Waves account
- Click on your icon in the upper right corner
- Select “Manage Subscriptions”
- Select “Cancel”
You can cancel anytime and you’ll retain access until the next billing cycle. Once the subscription is canceled, then access will be revoked at the next billing cycle.
How long is the free trial?
You have complete access to FXWA for 7 days. The free trial can be started here.
Why do you require I enter my credit card information for the trial?
First of all, we take your financial security seriously. The check-out page is secure and is managed by a third-party vendor that we use. See The Waves will never see your card information.
Also, we want to make sure you are serious about using the service. We are opening the doors for 7-days so you can see for yourself if FXWA is a good fit for you. We think you will fall in love with the service as you are receiving expert analysis but with the small-town care that you won’t find anywhere else.
If FXWA is not a good fit, then you can cancel before the 7-days is expired and pay nothing.
The first month’s payment is automatically withdrawn unless you cancel before the 7th day.
What if I don’t understand Elliott wave, can I benefit from the service?
It is helpful to have a basic understanding of Elliott Wave. However, we understand that at one time, each of us was new and inexperienced at Elliott wave.
Therefore, I would recommend you bundle this service together with our online Elliott wave course called Spotting Trends and Surfing Trades.
In the course, we teach students the five basic Elliott wave patterns so you can learn to read the charts to discover good risk to reward ratio trades.
You’ll receive additional perks like:
- A defined Elliott wave curriculum
- 24/7 on demand video lessons (375 minutes)
- Your Elliott wave labeling work reviewed by an Elliott wave expert
- Access to our discord community
- Live monthly Elliott wave education webinars
- Access to our 2022 Quarterly Trends Report covering:
- Bitcoin
- Ethereum
- EURUSD
- USDJPY
- DXY
The investment for the FX Growth Bundle is $82/month with a 7-day trial.
Contact us if you have further questions or if you are wondering if the service is right for you.