
Crypto markets have been consolidating and experiencing a small correction lately. This correction was anticipated when we analyzed bitcoin last week. Over the long haul, this should be a relatively shallow correction and will soon be forgotten.

Ethereum has been holding above a 20-month support trend line. I suspect this trend line will get tested in the coming days. Continuing to hold above this trend line implies the uptrend remains healthy.
As we’ll see in a moment, breaking below the trend line does not necessarily imply poor health for the ETHUSD chart, but simply a delay before punching to new all-time highs.
Ethereum’s Current Elliott Wave
There are three potential models that we’re following for Ethereum. The favored Elliott Wave count is that Ether just finished a smaller degree impulse wave on November 10 and has since been correcting lower in a smaller degree wave (ii).
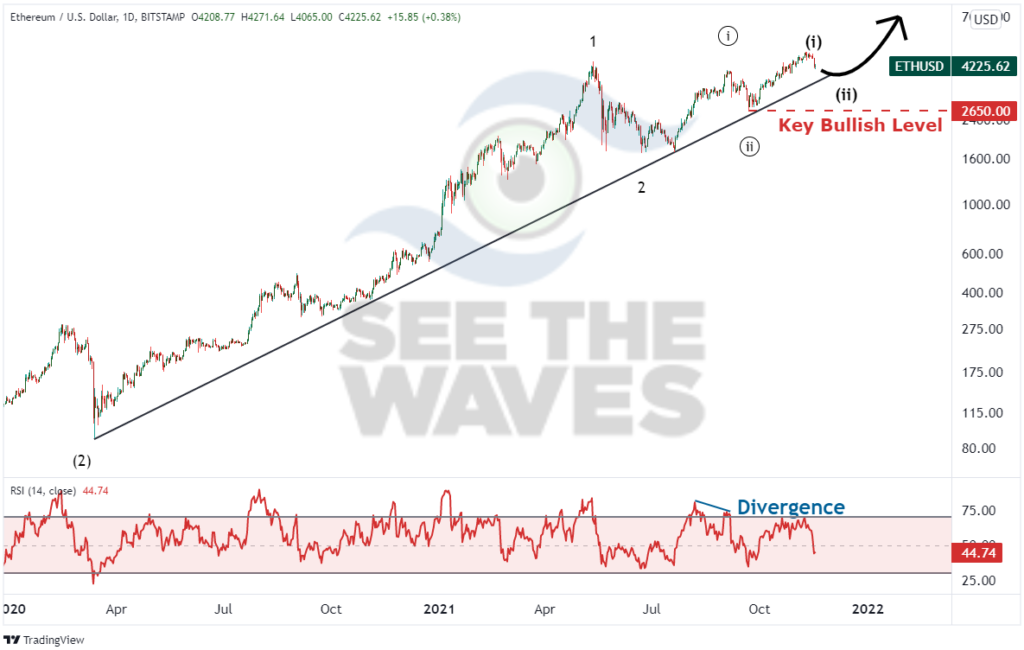
Due to the nature of the completed wave (i) impulse, Ethereum will likely fall below $3900.

This is because an ending diagonal pattern began on October 27 at $3900. Ending diagonals are a terminal wave at the end of a larger trend. This ending diagonal from October 27 to November 10 signals an end to the larger trend which began on September 21.
In the video below, we unpack this further and estimate a high probability target zone for this model and what to expect after a bullish turn.
As you can see in the video above, there are two other Elliott wave counts that we are following, but which we consider to be a lower probability. If the structure changes warrant us to reconsider these counts, then we will update you.
As you follow along with your own charts, make sure to use a logarithmic scaled price chart. This will help make the patterns easier to spot.
Elliott Wave FAQs
What is Elliott Wave Theory?
The market is believed to trend in five waves and correct in three waves. This combination of five and three waves creates five basic Elliot wave patterns. Based on this, an analyst reviews the price charts to determine which of the basic EW patterns are carving and, as a result, can describe and predict what may happen in the future.
Is Elliott Wave reliable for predicting the market’s price?
The market and its trends experience a geometry and harmony between the waves. Elliott Wave Theory is simply a way to describe the harmony which the market possesses. Sometimes, the geometry is obvious and other times it is not so obvious.
When we are on the scent, Elliott Wave can describe for us what may happen. Bear in mind that nothing is ever 100% when analyzing the markets. Elliot Wave Theory is only as good as its analyst.
How to learn Elliot wave
Like many things, learning a new skill does take some time. At See The Waves, we break your journey to learning Elliot wave down to four stages.
Stage 1: Learn the 5 basic Elliott wave patterns and rules
Stage 2: Learn to create your own coherent Elliott wave count
Stage 3: Generate coherent alternate Elliott wave counts
Stage 4: Determine which of the alternate counts are higher probability
We have training materials and access to Elliott wave experts to help you progress through each of the steps. Get started and continue your Elliott wave journey with the help of experts.