Cardano (ADA) is a cryptocurrency that is a smart contract platform seen to compete with Ethereum. In our last video analysis from August 30, we offered a couple of scenarios, and Elliott Wave Theory helped us describe one of the higher probability scenarios.
Current Elliott Wave Count for Cardano (ADA)
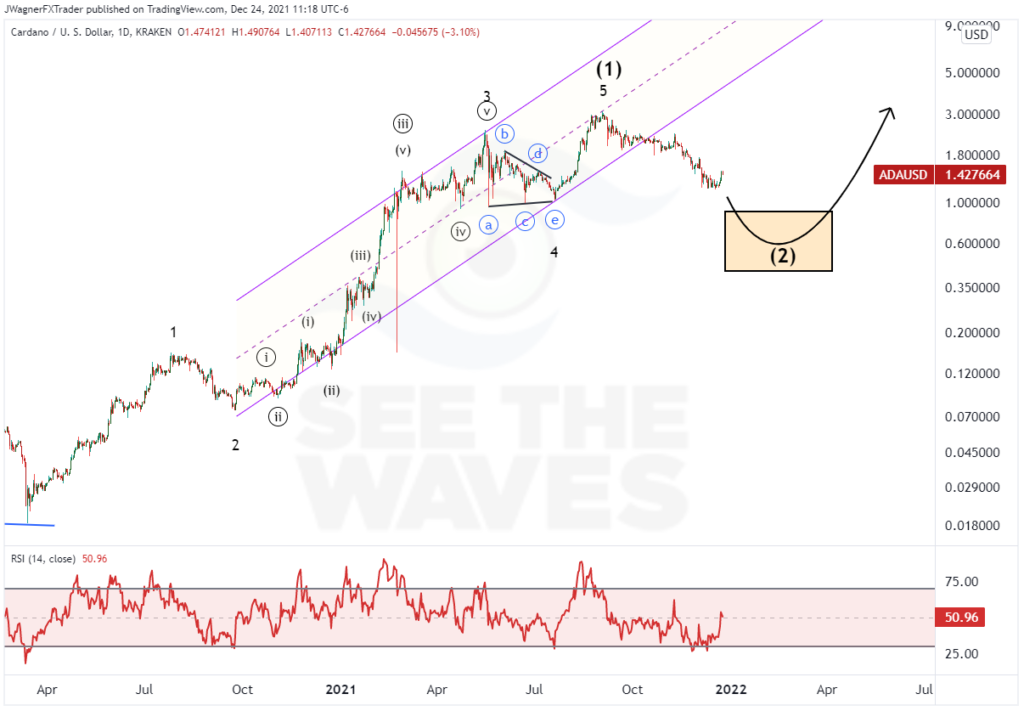
Using Elliott Wave Theory as our guide, Cardano completed an Elliott Wave impulse pattern at its September 2, 2021 high. This suggests that Cardano is going through a correction to retrace a portion of the impulse wave. The corrective wave began at the September 2 high and appears incomplete with more losses to come.
In our previous video analysis two days before the high, we laid out an alternate count that suggested Cardano might begin a correction soon that would take it back to the 4th wave low near $1.00 (see 6:03 mark of the Aug 30 video).
With such a deep cut taking place, this increases the odds that the impulse wave ended on September 2, and Cardano is correcting that uptrend.
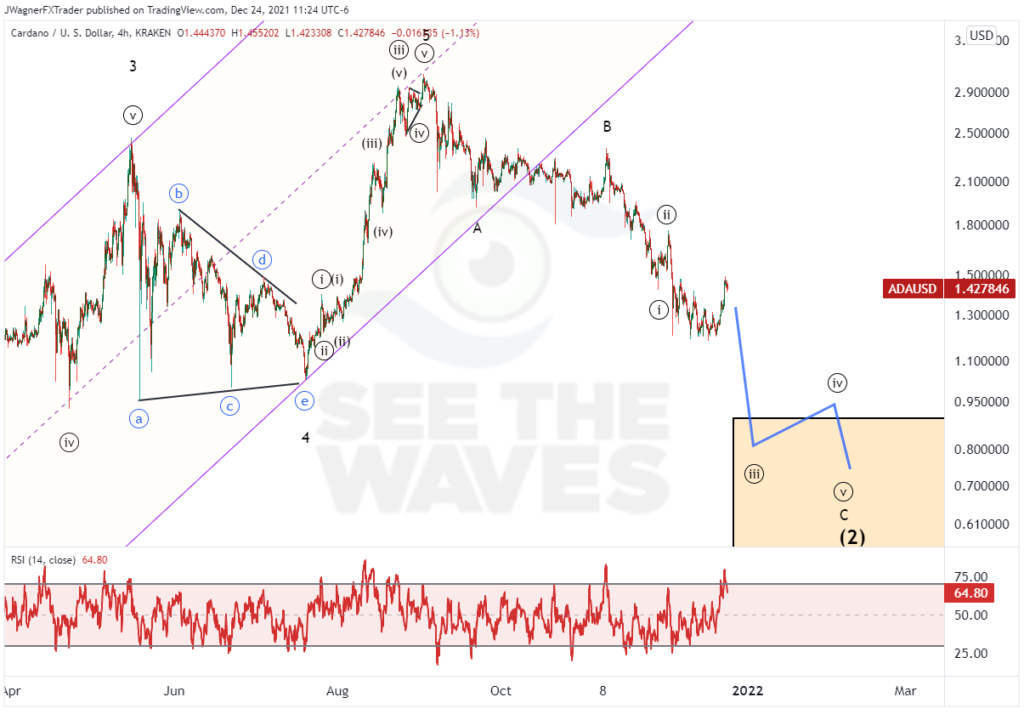
The intraday chart for Cardano suggests the correction is incomplete and has further progress to make. Wave relationships suggest Cardano may dip further to the 38% retracement level of the impulse wave (on a log scale). Therefore, the target region for this bearish correction to unfold is 0.44 – 0.90.
I realize this is a big range in price but when you are working on charts with large movements like crypto, it is important to convert to log scale charts.
On a log scale, the corrective dip to about .44 is only 1/3 of the entire impulse wave. It is relatively small when considering the potential upside.
Bottom line
Elliott Wave Theory helped guide us to the potential deep correction when we previously analyzed on August 30. Though Cardano has corrected over 65% to date, this corrective dip appears incomplete.
Additional targets suggest a correction may unfold to $0.44-0.90 before finding a meaningful bottom.
Learn more about how to read the charts and spot market trends with Elliott wave.
Cardano photo by Ruben Hanssen on Unsplash