
The cryptocurrency market has recently surpassed the $3 trillion market valuation for the first time. It was only earlier this year in January did the market surpass $1 trillion valuations for the first time so the value of the market continues to grow.
When compared to the valuation of other markets, crypto appears to still have plenty of room to grow. For example, consider:
- Gold market valuation ~$10 trillion
- Negative yielding bonds ~$17 trillion
- Global Equity market valuation ~117 trillion
When you look at that kind of wealth floating around, a dozen or two trillion could easily find its way into cryptocurrencies within the next few years…especially when you consider the government’s loose monetary policies.
The King of Cryptocurrency: Bitcoin
Bitcoin is considered the King of Cryptocurrency as it was the first one created and is by far the largest. Bitcoin is currently valued at near $1.2 trillion which is more than twice the value of the next largest cryptocurrency Ether.
Novices look to bitcoin’s price in the range of $60,000 per coin and think that it is expensive. However, determining the value of a cryptocurrency is more than its price per coin.
One way to review a cryptocurrency’s value is to study the price chart. At See The Waves we use Elliott Wave Theory to analyze the price history of bitcoin and dozens of other cryptocurrencies. Using the price history, we can analyze the current trends and maturity of the trends to identify potential patterns and paths the price of the crypto may experience.
In the video below, we start off with a plain bitcoin price chart, then piece together an analysis using the simple fact of Elliott Wave Theory…the market advances in five waves and corrects in three waves.
As you found out from the video above, we arrived at an explanation for the two favored Elliott wave paths for bitcoin. The favored path calls for a rally to drive bitcoin above $100,000 per coin and possibly as high as $220,000 per coin before a meaningful correction of 80%.
The second model suggests bitcoin may correct lower to the mid-30s before finding support and rallying again.
Favored Forecast for Bitcoin is Price Rally to $220k
The favored price prediction for bitcoin is a rally that works itself up to $220,000. This figure is derived using the Fibonacci retracement level and comparing this current rally to previous all-time highs.
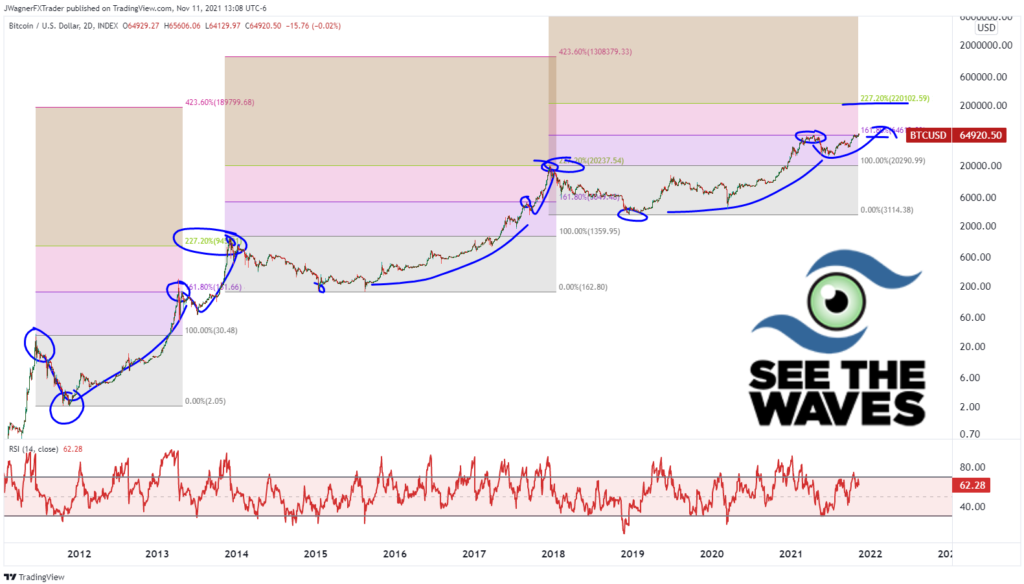
Applying the Fibonacci retracement from the 2017 high to the 2018 low yields a target at $220,000. To accurately duplicate this analysis on your own price charts, make sure you have converted your charts to log scale.
Elliott Wave FAQs
What is Elliott Wave Theory?
The market is believed to trend in five waves and correct in three waves. This combination of five and three waves creates five basis Elliott wave patterns. Based on this, an analyst reviews the price charts to determine which of the basic EW patterns are carving and, as a result, can describe and predict what may happen in the future.
Is Elliott Wave accurate?
The effectiveness of Elliott Wave can be debated as the analyst’s understanding and application of EWT plays an important role in the forecasts made. Determine for yourself if See The Waves can effectively use Elliott Wave Theory:
Is learning Elliott wave difficult?
Like many things, learning a new skill does take some time. At See The Waves, we break your journey to learning Elliott Wave down to four steps.
Stage 1 – Learn the 5 basic Elliott Wave patterns and rules
Stage 2 – Learn to create your own coherent Elliott wave count
Stage 3 – Generate coherent alternate Elliott wave counts
Stage 4 – Determine which of the alternate counts are higher probability
We have training materials and access to Elliott wave experts to help you progress through each of the steps. Get started on your journey and learn Elliott Wave today.