While most risk assets like the stock market, bitcoin, and Ethereum have been correcting as a result of the Russia-Ukraine conflict, altcoin Luna has been bucking the trend and rallying.
Let’s look at the chart for Terra Luna and see what trends and patterns can be detected using Elliott Wave Theory.
Terra Luna Elliott Wave Analysis
We previously reviewed Luna’s Elliott Wave price chart back in December 2021. The rally from the March 2020 low has developed into a five-wave rally. As a result, the larger trend is up, though we may see some setbacks in the near term.
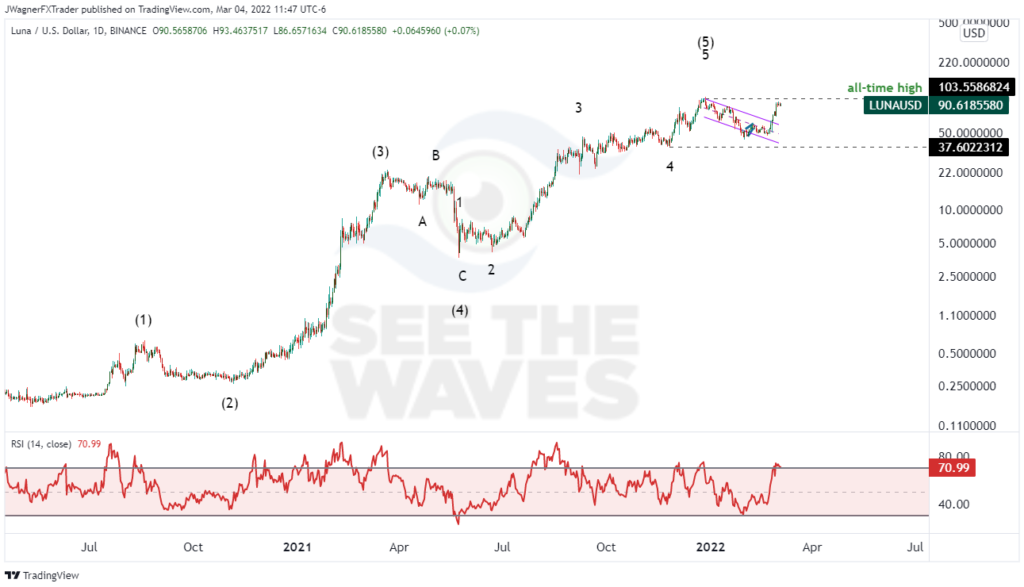
Within Elliott Wave, after a completed five-wave rally, we tend to see price retrace back to the previous fourth wave of the five-wave trend. This would imply a retracement back to $37. Early this year, Luna fell to $43. That could be far enough to complete the correction, but don’t bank on it just yet.
You see, the entire Elliott wave impulse rallied from March 2020 to December 2021. A rally of 20 months will need to see a correction of several months. The low of $43 occurred after only one month. There are no rules that negate the low being in January, but it is unlikely.
Current Elliott Wave for Luna
Given the volatility in the current market environment, I suspect LUNA is grinding through a larger correction that began in December 2021. Therefore, LUNA has started a corrective wave 2 lower or a corrective wave B.
This corrective wave likely works down to below $37 in the coming months (red labels).
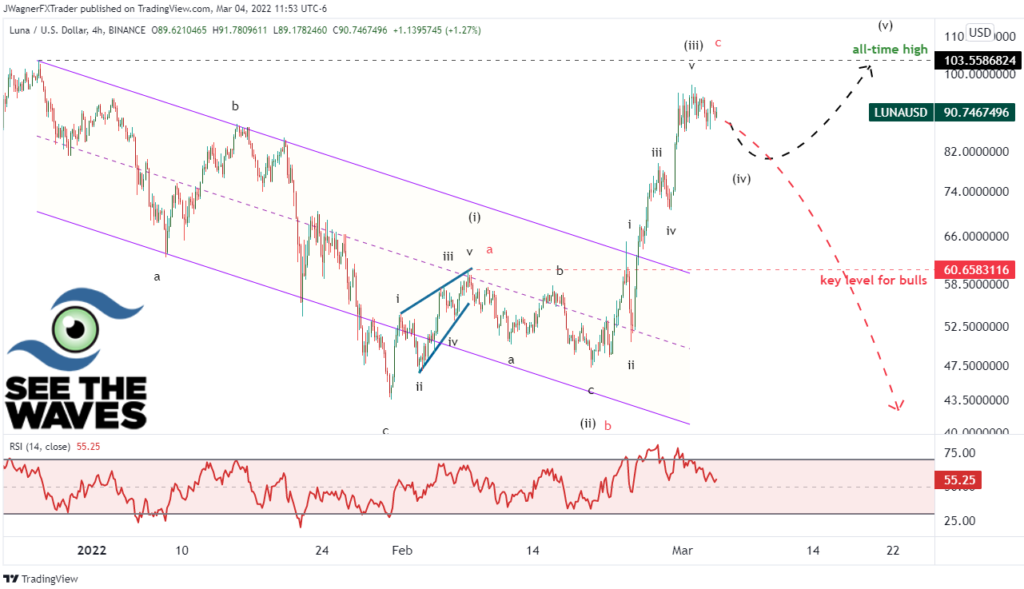
However, it is possible that despite all of the headwinds, Luna may be trying to rally in an impulse wave (black labels). If so, then Luna may drift lower to $70-$75 in the coming days, but it must stay above $60 en route to a new all-time high.
How to Determine Which Elliott Wave Count is Favored?
The obvious clue is if Luna breaks down below $60. That will overlap the top of a prosed wave (i) and negate the bullish impulse.
Another clue can be provided by the two biggest cryptocurrencies…bitcoin and Ethereum. There is a saying that “birds of a feather flock together.” If investors are bidding up the price of bitcoin and Ethereum, then it will likely support higher pricing for Luna.
That dynamic can also have the opposite effect. If bitcoin and Ethereum are correcting lower, then the entire crypto market is likely in distribution as well, including Luna.
At See The Waves, we have a Crypto Corner service that reviews the chart of bitcoin and Ethereum on a weekly basis using Elliott Wave Theory. Reach out to us for a trial run of the service to see if it is a fit for you.