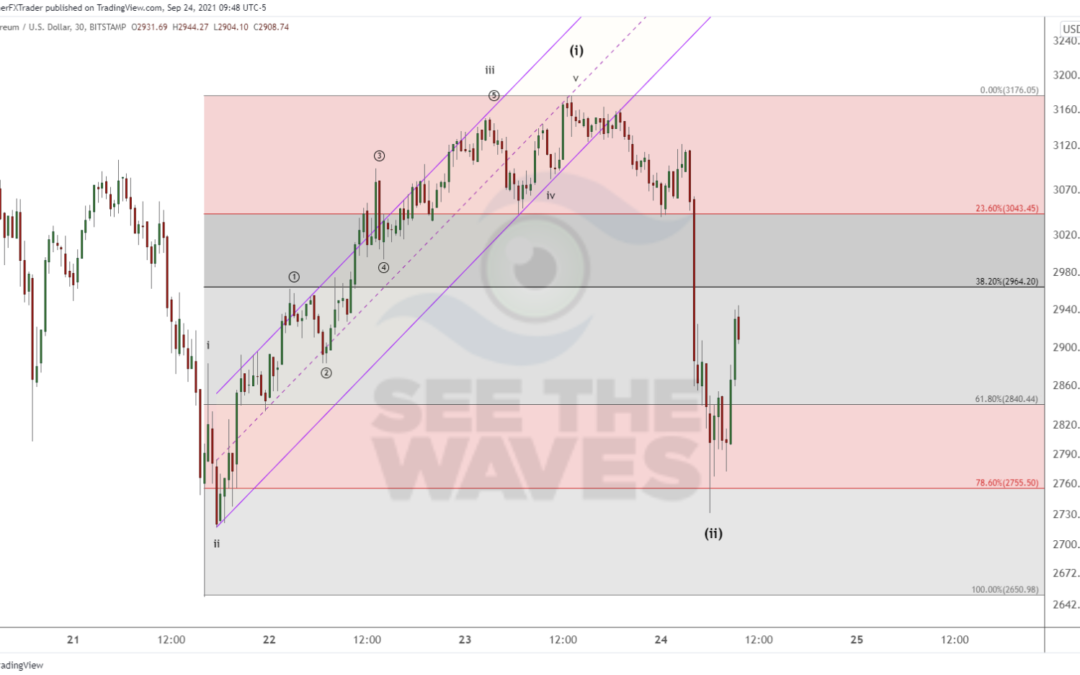
One problem that technical traders face is keeping their charts organized based on your train of thought. There are competing bits of information that are included within each analysis and the trader needs to discern which pieces are relevant and important to the outlook and which pieces are not.
One tool that I use that is extremely helpful in keeping my Elliott Wave counts organized is the TradingView charts.
TradingView charts are cloud-based and accessible from different devices. Plus, you can change the visibility of each tool.
Here is a video created for new Elliott wave traders to guide them through the use of the Elliott wave label tools within TradingView.
The above video simply discusses how to add the labels to the charts and a little on how to organize the charts using the degree of trend and visibility features.
There are more nuances to implementing and analyzing the charts using Elliott wave. Join our Spotting Trends and Surfing waves course to learn Elliott Wave Theory and how to read the charts to identify trades.
Interested in free Elliott wave analytical articles? Find some in our blog.

