You’ve just reviewed some research on a company with growing earnings. You review their product and it is within a growing industry.
Then, you decide to buy the stock only to see the price fall.
If you have traded for any time, it is likely you have had this happen to you. Perhaps, this scenario has played out so frequently that you conclude the market reverses as soon as you buy.
It is easy to get emotionally involved in an investment with a good story. There is one thing that a good story won’t tell you…where to buy in and where to sell in a market.
You see, the story remains “good” whether the prices are high or whether they are low. The story might offer a long-term forecast of what the price may be well into the future. However, on a shorter to medium-term basis, the “good” story doesn’t give you a signal to buy now.
How Chart Reading Helps Traders
Chart reading is the solution to the problem of timing trades. Though many financial advisors suggest that timing trades is a fool’s game, many traders would argue otherwise.
The reason chart reading works is because the buy and sell trades are created by humans. The back and forth between greed and fear helps create the trends within the market. The patterns that guided our ancestors to look for berries in the spring and hunker down for winter are similar patterns to how we take risks and protect our capital.
Due to the trading being conducted by humans, the trends that appear in the market are patterned. We might not be able to explain EVERY wave of EVERY pattern, but there are some recurring patterns that appear.
Your job as a chart reader is to find those patterns that appear and that have good risk to reward ratio opportunities.
For example, jumping over a 5-meter-wide gap that is 100 meters deep to eat ten berries is not a good risk to reward ratio.
However, stepping over a 1-meter-wide gap that is 5 meters deep has much less risk making the reward more worthwhile.
Chart reading helps you discern the difference between two opportunities by comparing the risk to reward.
Effective chart reading will indicate where you should get into the trade and where to get out of the trade.
Effective chart reading will set you up so that you do not have to be ‘right’ on all of your trades. You can lose on trades and still make a profit in your account.
What Would You Do?
Chart reading will help frame the market’s past price history for you. However, we can still get emotionally attached to trades and markets.
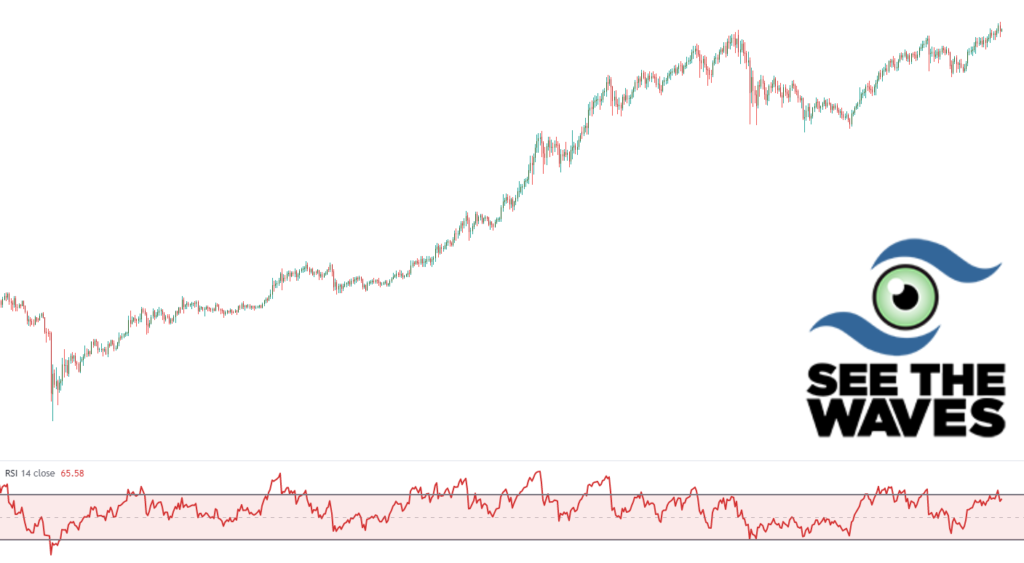
One way to overcome this bias is by wiping away the name of the market and removing the price scale from the chart. Then, you’ll end up with a chart that looks something similar to the chart above.
As the indicators and drawings are added, the analysis on the chart begins to come to life.
What is clear from this chart is this trend is firmly planted to the upside. Until the support trend line is broken, a trader can anticipate higher prices while keeping an eye on the parallel lines.

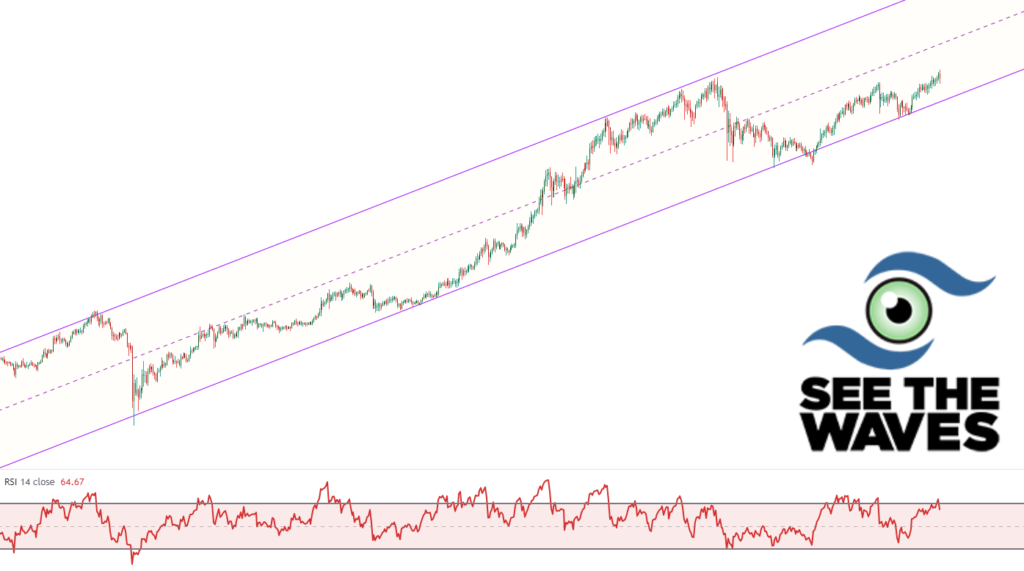
In fact, if we change the time scale a little and zoom out, we see this pattern forming. The indicator added to the chart is a Fibonacci Channel which works similarly to the Price Channel tool.
Notice how prices have been respecting each of the four parallel lines on the chart. There are several touches of the various parallel lines going back multiple years. This is another indication that price is firmly planted in an uptrend.

Let’s add back the price and the time scale.
This is a chart of the total valuation of the cryptocurrency market, called the cryptocurrency market capitalization. Floods of investment continue to pour into bitcoin and other cryptocurrencies.
As you can see, this trend is well established to the upside.

In fact, if we zoom in, there is a confluence of levels overlapping each other near a $3.7 trillion valuation. The current value of all cryptocurrencies is $2.6 trillion.
As a result, this market could easily jump up to $3.7 trillion which is a 40% increase over current levels. Bitcoin is by far the largest cryptocurrency valued at over $1.1 trillion. If bitcoin were to increase 40%, then that would place its current price between $90-100k per coin.
A breakdown of the total cryptocurrency market capitalization below $2.0 trillion (the purple support line) would create a concern that the sentiment of the market has changed and deeper cuts may be on the way.
Learn to Read the Price Charts
Learning to read price charts may appear intimidating at first, but it does not have to be difficult. You need an experienced mentor to guide you through the process step by step.
I can help you read the charts on your own. When you register for the Spotting Trends and Surfing Waves course, you will receive access to courses on learning to read the financial market charts, even if you do not know how to open the chart (yet)!
Let’s get started. I can help you!
Other Analysis You Might Be Interested In…
Free chart analysis including Elliott wave analysis