Though there are many ways to identify levels of support and resistance, spotting meaningful levels does not have to be difficult.
Zooming out to a larger time frame can offer stronger levels because more price action and time were needed to develop the support or resistance.
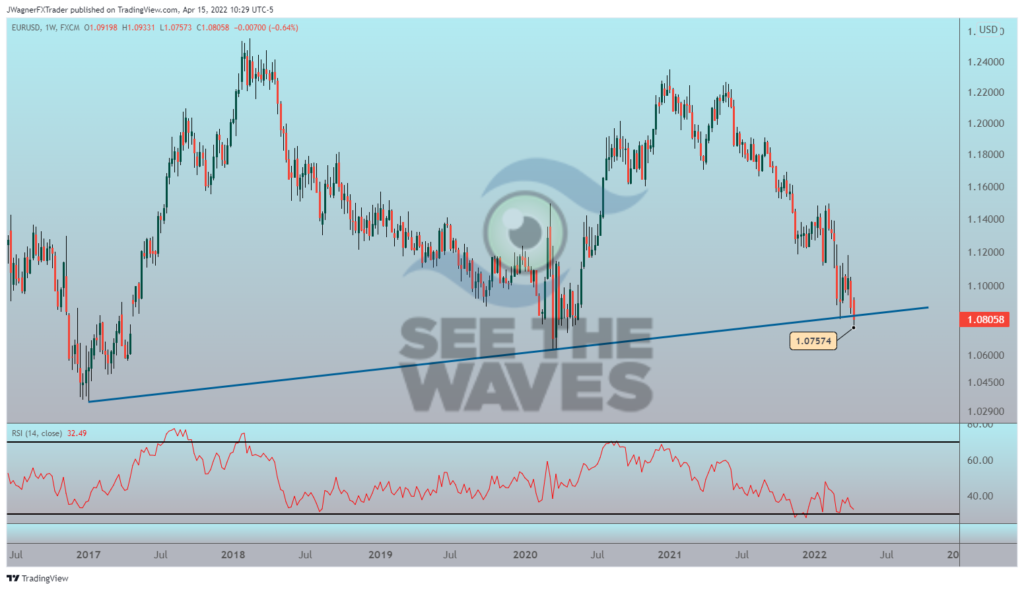
5 years of price history for EURUSD

Going back to January 2017, we can draw a trendline matching the lows from 2017 and 2020. When we extend this line off to the right current price action has been dancing around this line for a month now.
A support level with this long history will initially act like a brick wall. It is possible that prices may force their way through, it may take a couple of punches before making it all of the way to the other side.
What is the current Elliott Wave for EURUSD?
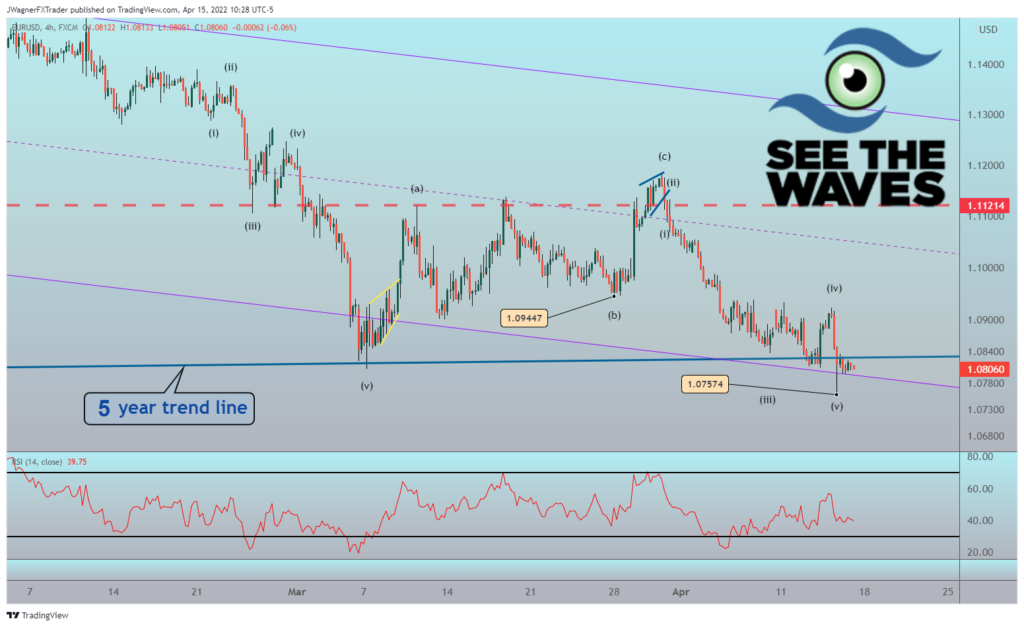
I can count the minimum waves in place for a massive bullish reversal. A bullish reversal, if it were to develop, would be confirmed on a five-wave rally followed by a three-wave partial setback.
There is another pattern that that suggests a meaningful break of this trend line and EURUSD plummets lower in a wave ‘3’.

Personally, I would like to see a massive EURUSD rally. However, with nearly 3 out of 4 live traders positioned to the long side, sentiment suggests a breakdown may be on the horizon.
A breakdown below this trendline may suggest massive risk aversion in the global markets.
Therefore, I suspect we may see a wave ‘3’ lower to reaches 1.06 or lower levels.
Interested in weekly Elliott wave forex analysis?
Each week, receive analysis from a Certified Elliott Wave Analyst on six major FX pairs. The analysis will provide an Elliott wave count and oftentimes an alternated. The analysis also includes a description of the expectation of price action.
Gain access to the previous reports when you register now but wait to make your first monthly investment for 7-days.
Receive access to weekly Elliott wave analysis on:
- EURUSD
- USDJPY
- GBPUSD
- AUDUSD
- USDCAD
- DXY
