Nearly 1 year ago on September 3, 2020, Dow Jones Industrial Average and the US indices began a 10% correction that lasted two months. As we approach the one-year anniversary of the decline, what can we learn about its current pattern and what to expect?
DJI’s Elliott Wave Pattern Since the Pandemic Low
Using Elliott Wave Theory as our guide, we will look for a series of 5-wave advances followed by 3-wave declines. When the 5-wave advance is over, then we can anticipate a larger decline unfolding. Elliott Wave Theory is counting in a series of three and fives waves to uncover the larger patterns.

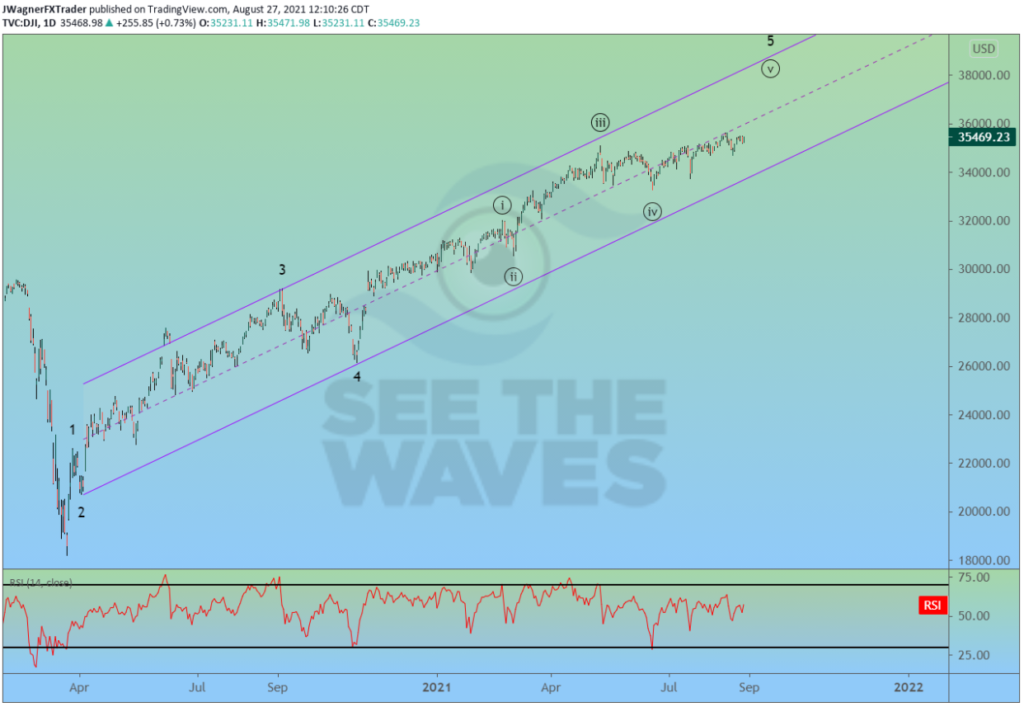
One way to count the September – October 2020 correction was a wave 4 decline. That suggests the rally since November 2020 is a fifth and final wave to the larger sequence which began at the March 2020 pandemic low.
Each of the motive waves (waves 1, 3, 5) must also subdivide into 5-waves. In the image above, we can see partial and incomplete subdivisions of wave 5.
Current Elliott Wave For DJI
On the daily chart, the current Elliott wave appears to be wave ((v)) of 5. This suggests DJI may be in an ending wave at two different degrees of trend. The implication is that a correction is looming nearby that would pull DJI down to 33,250 and possibly retrace the entirety of the past year’s rally.
The wave which began in March 2020 is an Elliott Wave impulse pattern. When the fifth and final wave is in place, then we can expect a deeper correction to take hold. This would be the largest correction since March 2020. I’ve created this 4-minute video to explain what to expect after a completed impulse wave.
Dow Jones Industrial Intraday Chart
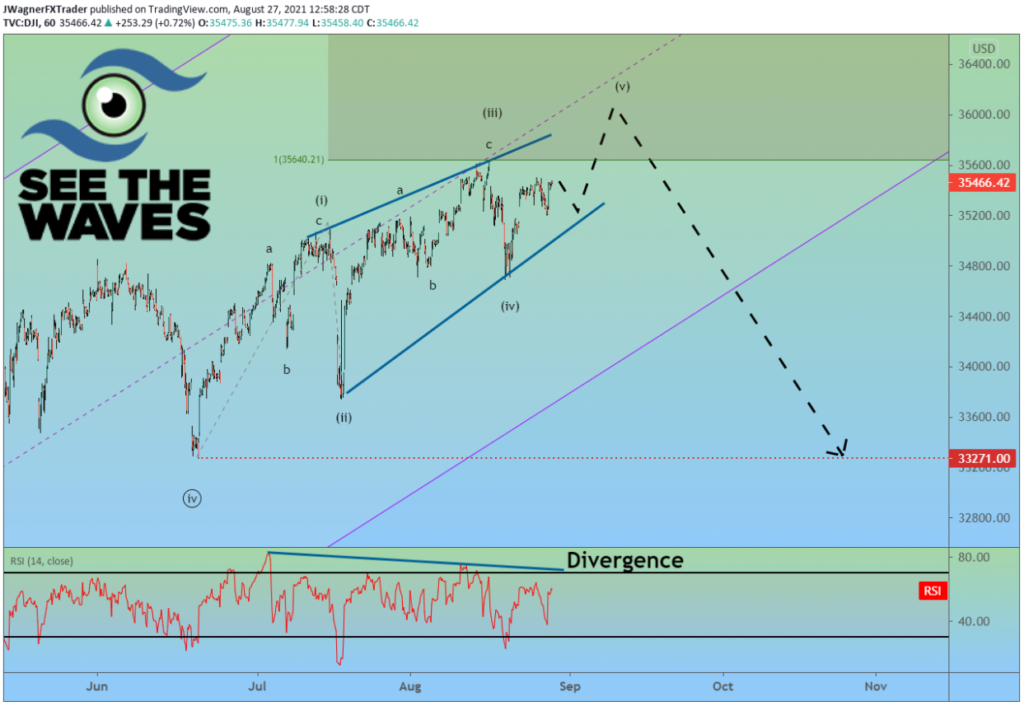
Let’s zoom in a little further on the chart to review the subwaves since the wave ((iv)) low.
The price action seems sloppy and overlapping which is not a robust motive wave. Behavior such as this may indicate the market is carving out a diagonal pattern. Ending diagonals do appear in the 5th wave positions of an Elliott wave structure.

This ending diagonal pattern does appear mature in structure, but incomplete. Therefore, additional highs above 35,600 cannot be ruled out, but these highs are not ones to be bought.
After the ending diagonal pattern completes, we can anticipate a retracement back to the origination of the diagonal at $33,271 and possibly lower levels. A break down below the blue support trend line of the diagonal will be an initial clue that a larger correction is about to unfold.
The Elliott wave structure suggests the largest correction since March 2020 is just around the corner so cheaper levels to buy DJI may appear in the future.
This makes sense as my recent bitcoin Elliott wave analysis suggests a correction may begin soon.

