by Jeremy Wagner, CEWA-M | Aug 27, 2021 | Chart Analysis
Nearly 1 year ago on September 3, 2020, Dow Jones Industrial Average and the US indices began a 10% correction that lasted two months. As we approach the one-year anniversary of the decline, what can we learn about its current pattern and what to expect? DJI’s...

by Jeremy Wagner, CEWA-M | Aug 25, 2021 | Chart Analysis
Bitcoin has rallied nearly 70% over the past month to recover the majority of its summer collapse. Using Elliott Wave Theory as our guide, we can gain a sense of the picture the market is painting for us. The good news is that bitcoin appears to have an...

by Jeremy Wagner, CEWA-M | Aug 22, 2021 | Chart Analysis
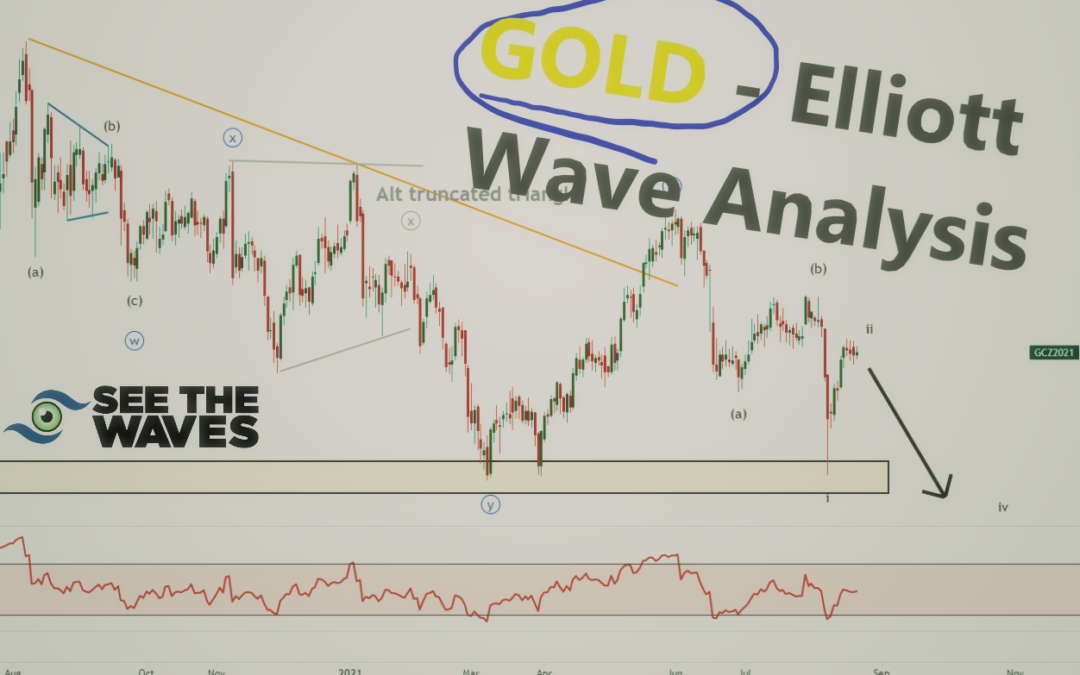
Gold is running out of real estate if the bears are going to take over. Using Elliott Wave as our guide, let’s look at a bearish perspective that suggests gold could collapse harshly. This view could see gold fall into the 1500’s. However, if gold rallies,...


