Elliott Wave Analysis
- Minimum waves in place for a completed Elliott Wave double zigzag pattern
- Impulsive wave in place for a potentially bullish turn
- Targets new highs above 1.23
Current EURUSD Elliott Wave
It appears October has produced the end to a 10-month long wave. In Elliott wave terms, the 2021 wave was a double zigzag pattern labeled ((w))-((x))-((y)) where waves ((w)) and ((y)) were zigzag patterns.
A double zigzag pattern is a corrective pattern that implies the whole 10-month long trend lower will soon be completely retraced.
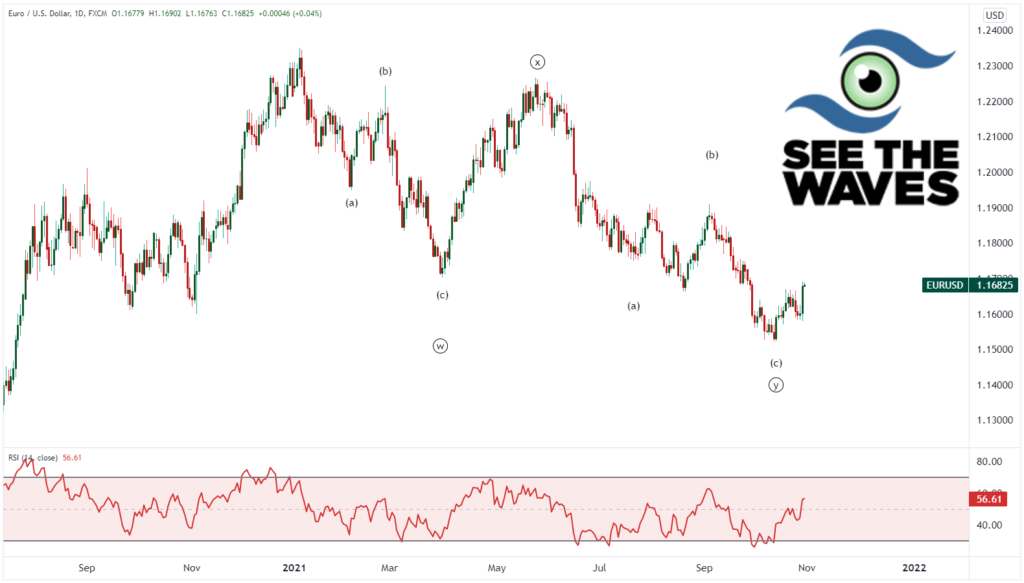
If you recall, on January 6, 2021, we conducted a live webinar on EURUSD (and DXY) and made a couple of bold forecasts.
- The US dollar was about to begin its largest rally since March 2020
- EURUSD will retest its wave ((iv)) low at 1.16
Both elements of the forecast came true in October 2021 as EURUSD fell to below 1.16. For a review of the January 6, 2021 forecast, check out this video below.
Internal Elliott Wave Structure for EURUSD
The first zigzag of the double zigzag unfolded from January to March 2021 and is labeled wave ((w)). This structure has an internal zigzag labeled (a)-(b)-(c).
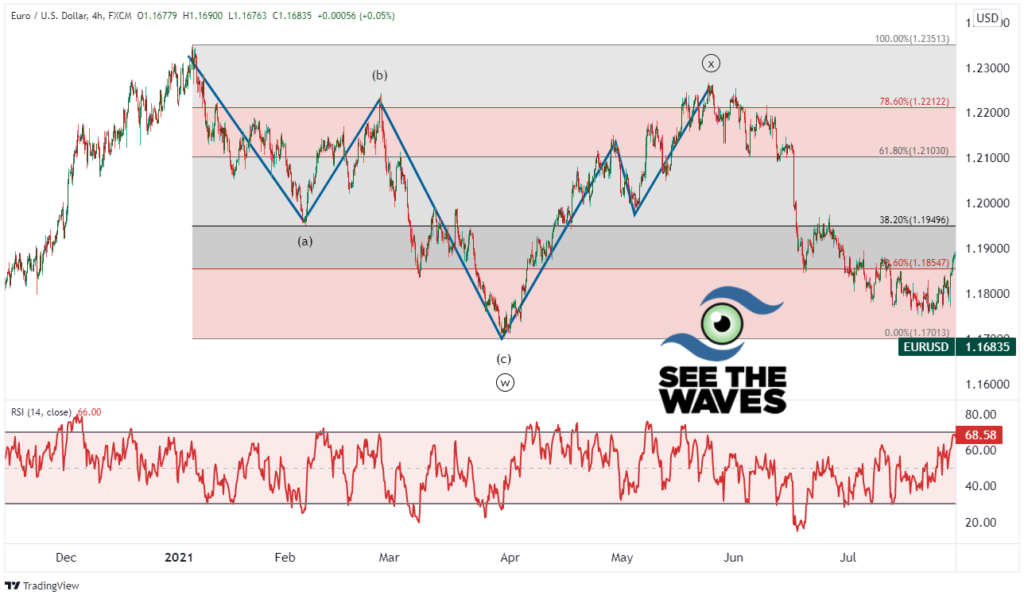
Then, a rally ensued back to the 1.22 handle. This rally served as an interruption ((x)) wave and typically are deep retracements going to at least the 61.8% level. This ((x)) wave retraced about 80% of wave ((w)).
From there, the next bearish zigzag formed beginning in late May 2021.
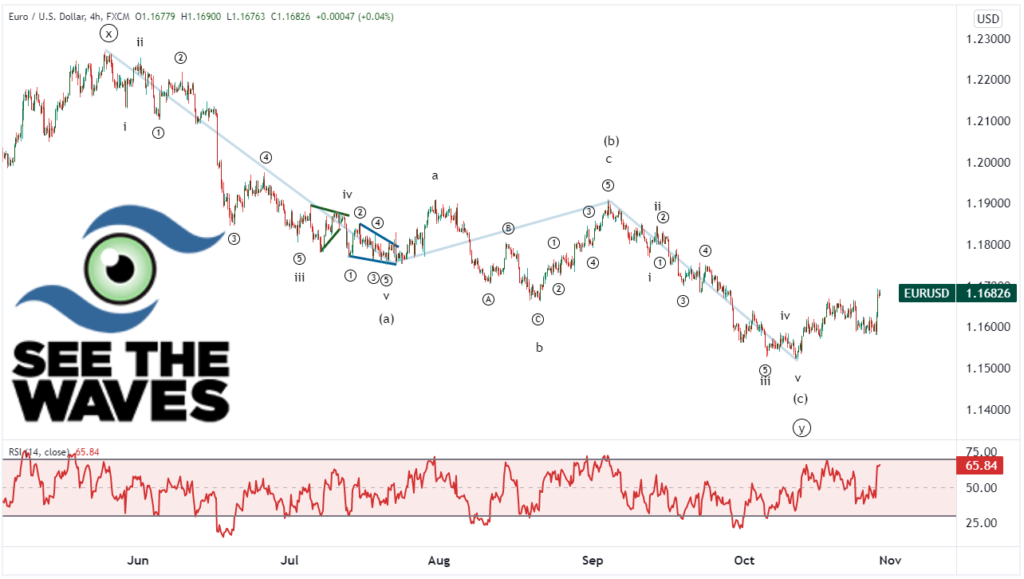
Wave (a) of the zigzag formed from June to July 2021 as a really nice impulse wave pattern. Wave iii of the impulse was the extended wave. Wave iv of the impulse was a triangle. Wave v of the impulse was an ending diagonal pattern.
After a completed ending diagonal in July, expect the market to completely retrace the whole pattern and it did in the latter portion of July.
Turns out that wave (b) of the zigzag formed as an expanded flat pattern. Expanded flat patterns are when the ‘b’ wave extends beyond the beginning of the ‘a’ wave which is what happened in August 2021.
After the (b) wave of the zigzag was completed in early September, EURUSD fell again in the (c) and final wave of the zigzag.
This (c) wave lower was an ending wave at two different degrees of trend. Degrees of trend in Elliott wave terms are analogous to two different power ratings on a microscope. We are showing this pattern is completed at multiple powers in the microscope suggesting an important trend change is looming nearby.
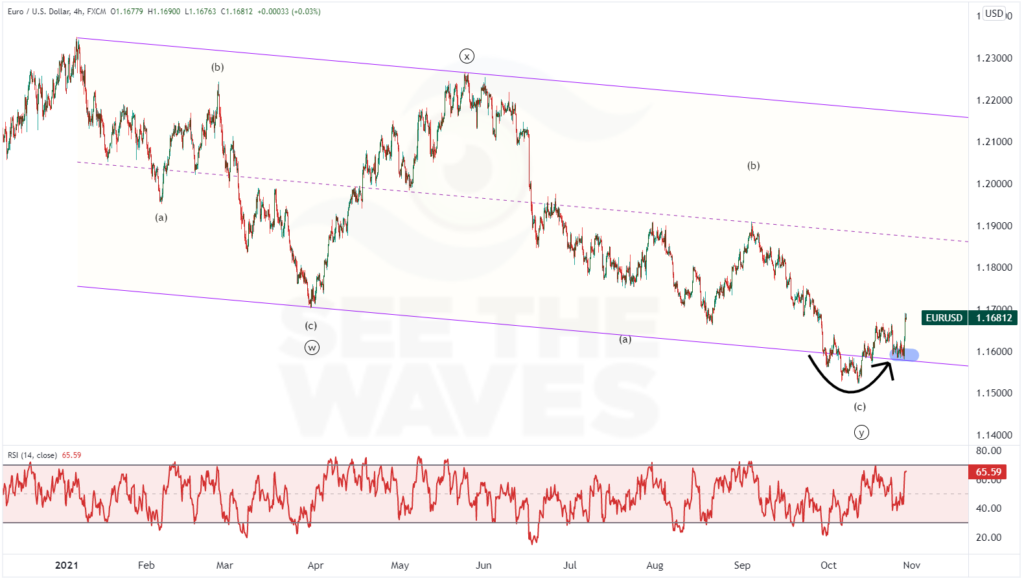
Another interesting aspect of this chart pattern is that prices briefly popped down below this price channel, only to re-insert themselves back inside. From time to time, prices will over-shoot a price channel. Once they re-enter the channel, then it provides another clue that the trend may have switched from down to up.
Upon re-entering the channel, EURUSD prices have rested on top of the channel and took off higher earlier today. These are all bullish symptoms for the largest currency pair.
EURUSD Forecast
What’s next for EURUSD? This double zigzag pattern is a corrective pattern and suggests that EURUSD may be ready to rally to new highs above 1.23 and possibly higher levels.
Look for bullish Elliott wave patterns, like a 5-3 wave pattern, to form nearby as that will provide additional clues that a turn higher has begun.
Learn Elliott Wave
The forecast for EURUSD was made back in January 2021 for a decline to 1.16. Now that the decline has occurred, we are now looking for a significant rally back to 1.23 and possibly higher levels.
These forecasts are made using Elliott Wave Theory as our guide. I can teach you Elliott wave so you can learn to identify significant market turns and how far they might carry.
Learn more about our services on teaching you how to read charts.
For other analyses you might be interested in, check out our Elliott Wave Analysis blog.

